“Still, after all these years, we feel we’re only just started on a much bigger journey - a new level of change we can instigate now that we have such strong trust of a tightly knit network of farmers and roasters. ”
One of our intentions for this year is to keep pushing the boundaries of transparency, raising the bar for what a good middleman should show. From now on we will present annually how and where we earned and spent our money, in a way that is easy to grasp.
In summary, we are proud that we did well last year, and that we are entering a whole new phase of our growth. One in which we structurally need to think how to invest our profits to create more far-reaching impact. Still, after all these years, we feel we’re only just started on a much bigger journey - a new level of change we can instigate now that we have such strong trust of a tightly knit network of farmers and roasters.
For now, let’s dive into last year in more detail.
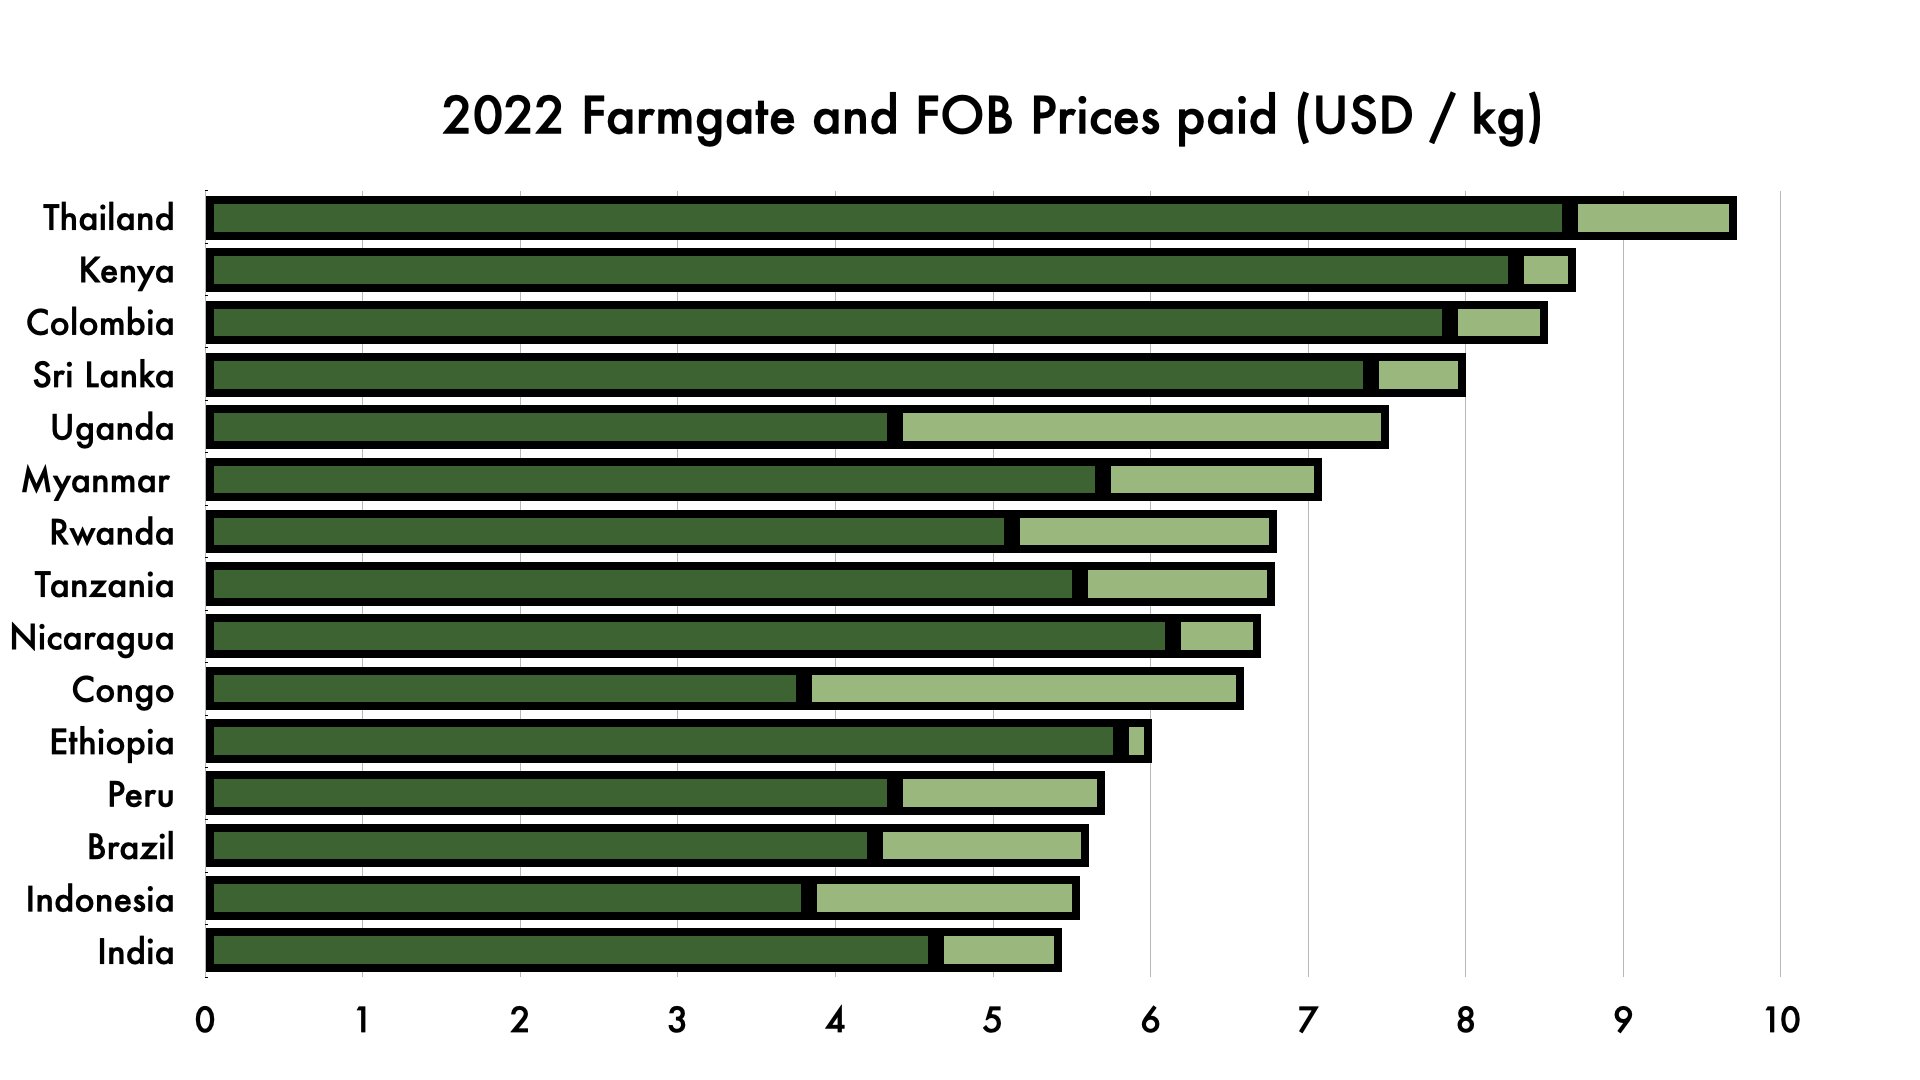
Average Farmgate price :
USD 6,52 / kg
Although Maarten, Mathieu and Madhu are working on a far more sophisticated cost of production calculation for each of our origin partners and the farmers they work with, this year we can already give you a fairly accurate estimate of the part of the price that actually goes to farmers in all our origins. For reference, we have plotted the farmgate and FOB prices (the price paid to the exporter excluding all international shipping costs) per origin in the graph below - a caveat is that we define “farmgate” as the cash in hands of the owner of the coffee farm. This means that estate holders obviously receive a relatively much larger piece of the farmgate pie than coops and independent exporters.
Total volume imported:
487.319 kg
Our coffee imports rose with 53% compared to 2021. Included in the graph below are all the imports of the 2022 harvest per origin - for better oversight, we did not include imports of different harvests of the same origin that both occurred in 2022. For reference, 1 container equals 19.000 kg of green coffee.

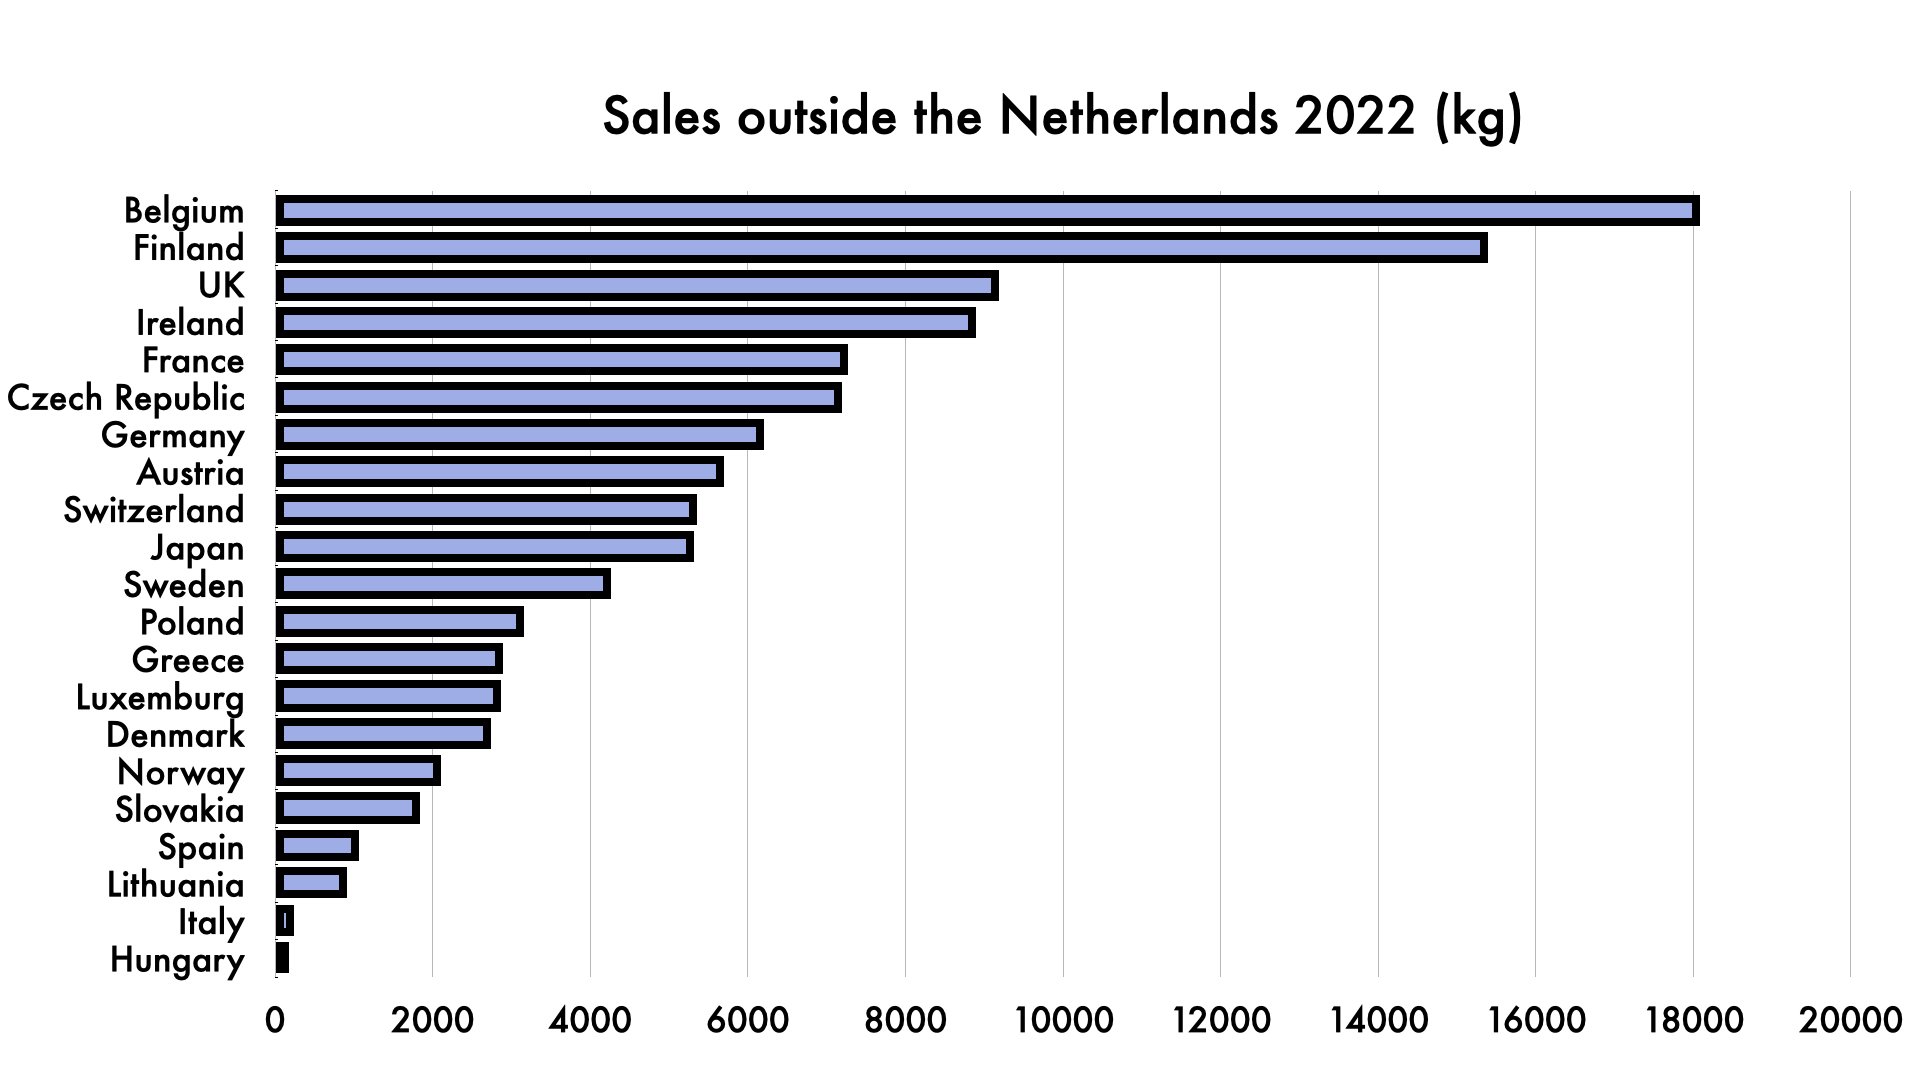
Sales per Country.
By far the largest country we sell in is our home in the Netherlands. This is not only because we are most known here, but also because we have a separate business selling coffee for large corporate / governmental tenders. You can see where we sell the remaining 27% in the chart below.

Total Revenue :
€ 2.970.363
This Side Up grew by 71% in revenues compared to 2021, a larger growth than the growth in volume because of higher coffee prices. Below is a detailed graph of our growth since 2015, showing that recently things have truly begun to take off. We attribute this to a large part to your loyalty: The growth with existing customers was 44% and with new customers 23%. In other words, we are proud that you entrusted us with so much more of your coffee requirements than in the years before. Our gratitude couldn’t be bigger: our impact as a network is becoming a visible force in the coffee world. Our net profit has also never been bigger - and instead of handing out bonuses, we use this buffer to become more independent: by assuring healthy cash flow and becoming a more interesting investment for impact lenders.

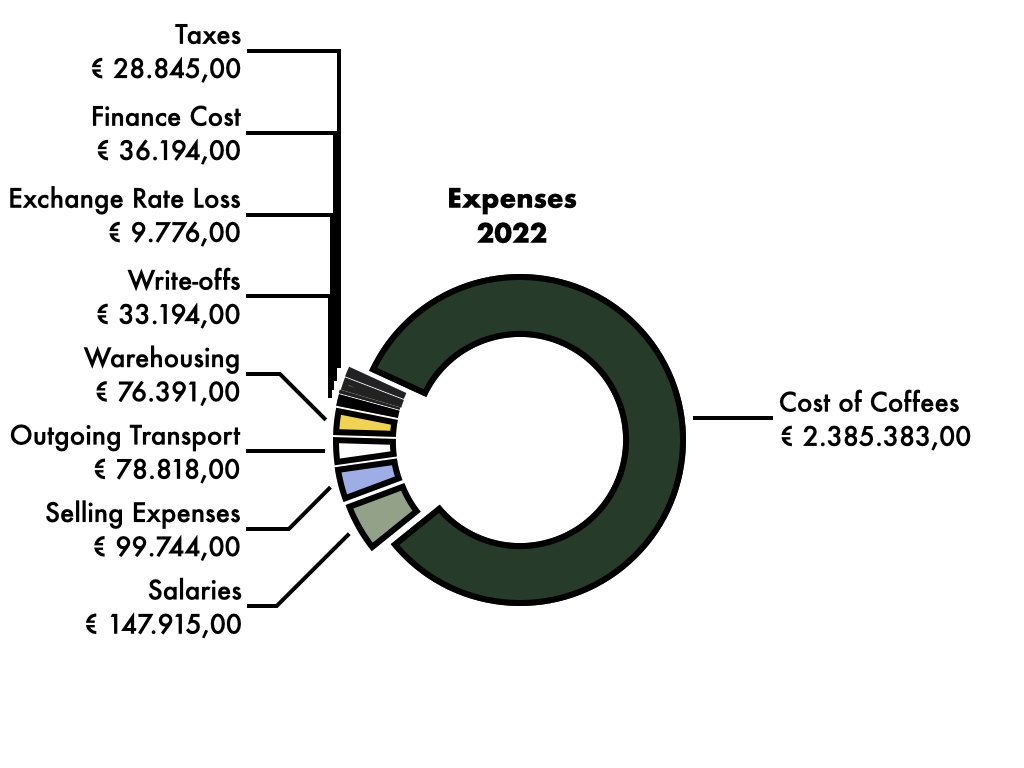
How we spent our money.
Below is an overview of our expenses, the total of which was € 2.896.260. That’s an increase of 63% compared to 2021, mainly due to increased coffee purchases. Other increases included more origin travel post-corona, a severe quality issue we decided to write off 50% of with our friends in Peru, and of course organising the Producer Crossover in Milan which included flight tickets for all attending producers (under Selling Expenses). As you can see, we contribute quite significantly to keeping warehousing and outgoing transportation costs manageable for roasters.
This Side Up daily wage :
€ 190
Not many of you may know this, but This Side Up has a single rate for a day of work at the company. Whether it’s the founder or someone just starting out, we all earn the same, applied to the amount of days we work. This sum is before taxes and is adjusted according to whether the contract is on a self-employed basis or true wage labour, or in the case of Milena who works from Mexico, we adjust for local living standards.
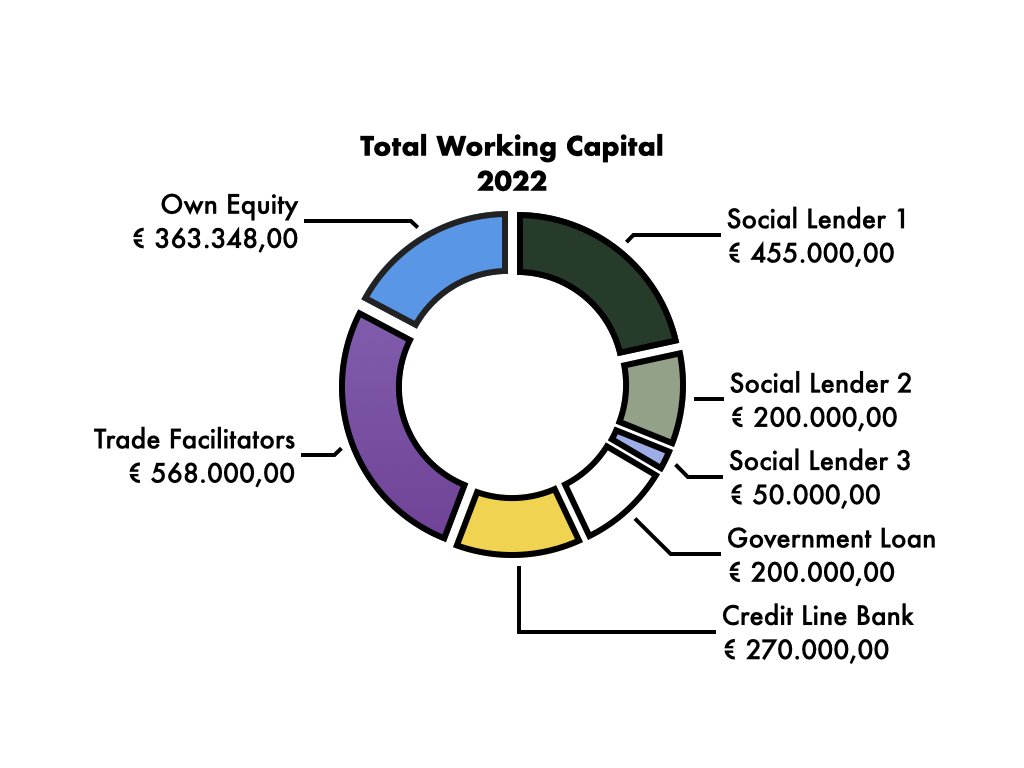
Where do we get our
working capital?
Our biggest concern has always been to ascertain enough working capital to keep up with roaster demand. Although we now have the possibility to get some credit at our bank, this is fairly recent and a small part of our total portfolio, which consists mostly of social impact lenders, trade facilitators and increasingly, our own equity.
This year will be a major task to expand this portfolio. In our view, who wouldn’t want to invest in so much impact across such a beautiful scope of communities worldwide - now to transfer that excitement onto potential lenders! If you know anyone who fits the profile, we’d be grateful if you could recommend us to them…
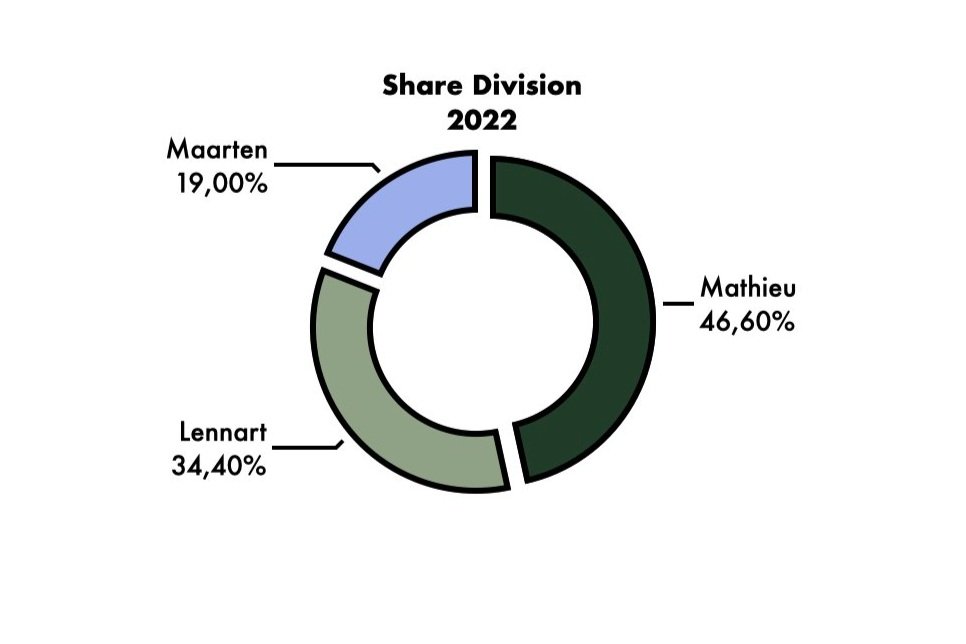
Who owns This Side Up?
Last year, Bas Clerkx left TSU as an investor, leaving the company now fully in the hands of Lennart, Mathieu and Maarten. Here you can see the division of shares.
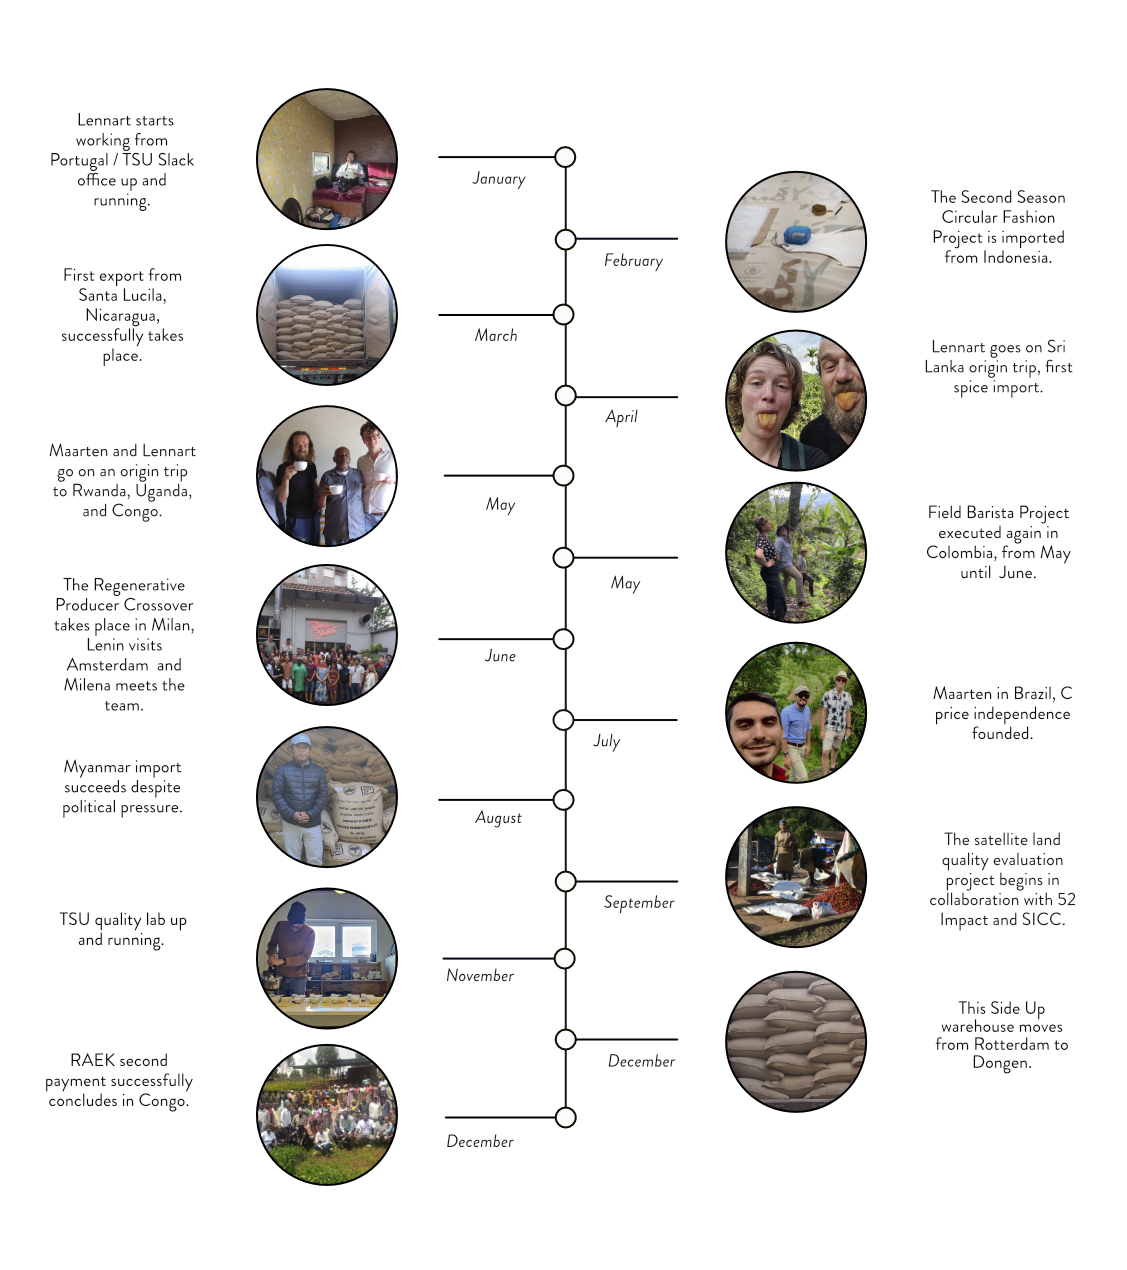
Some highlights of the year.
Of course, numbers don’t tell the full story. This Side Up had an amazing year of adventures, personal growth, deep bonding within the team and with origin partners and roasters - stuff that is hard to grasp in written language and graphs. Here is an attempt though: a timeline of a few of the things we look back to with joy and pride.